
Congratulations to the USDA/APHIS for getting ahead of the curve and making the US the first country to publish its 2014 animal research statistics. Overall, the number of animals (covered by the Animal Welfare Act) used in research fell 6.4% from 891,161 (2013) to 834,453 (2014).
These statistics do not include all animals as most mice, rats, and fish are not covered by the Animal Welfare Act – though they are still covered by other regulations that protect animal welfare. We also have not included the 166,274 animals which were kept in research facilities in 2014 but were not involved in any research studies.
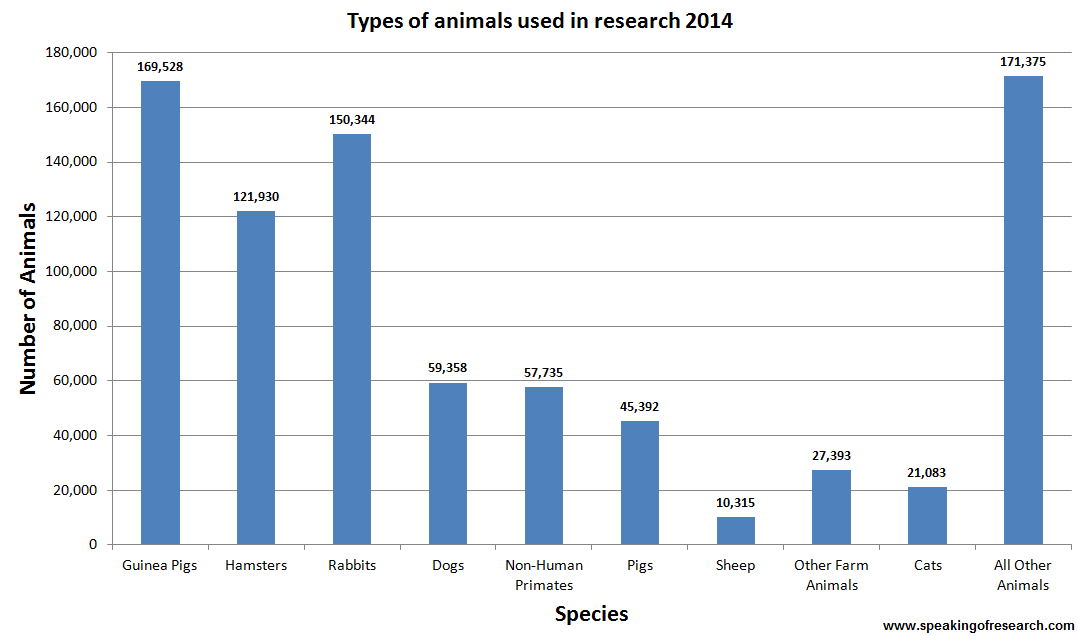 Statistics from previous years show that most of the “All other animals” species are rodents (but not mice or rats). 53% of research is on guinea pigs, hamsters and rabbits, while 10% is on dogs or cats and 7% on non-human primates. In the UK, where mice, rats, fish and birds are counted in the annual statistics, over 97% of research is on rodents, birds and fish. Across the EU, which measures animal use slightly differently, 93% of research is on species not counted under the Animal Welfare Act. We would expect similar patterns to be true in the US – although there are no statistics to confirm this.

If we look at the changes between the 2013 and 2014 statistics we can see a drop in the number of animals of most species , with only the “all other animals” category showing a rise. This is the second year in which the number of many species has fallen. For example, the number of rabbits used in 2014 fell 11.4% from 2013, following a 9.2% fall from 2012.
Most notably the number of non-human primates has fallen by 9.9%, the number of dogs fell 12.4% and the number of cats fell by 13%. This has shown these species taking up a smaller proportion of the research animals used, as can be seen below:
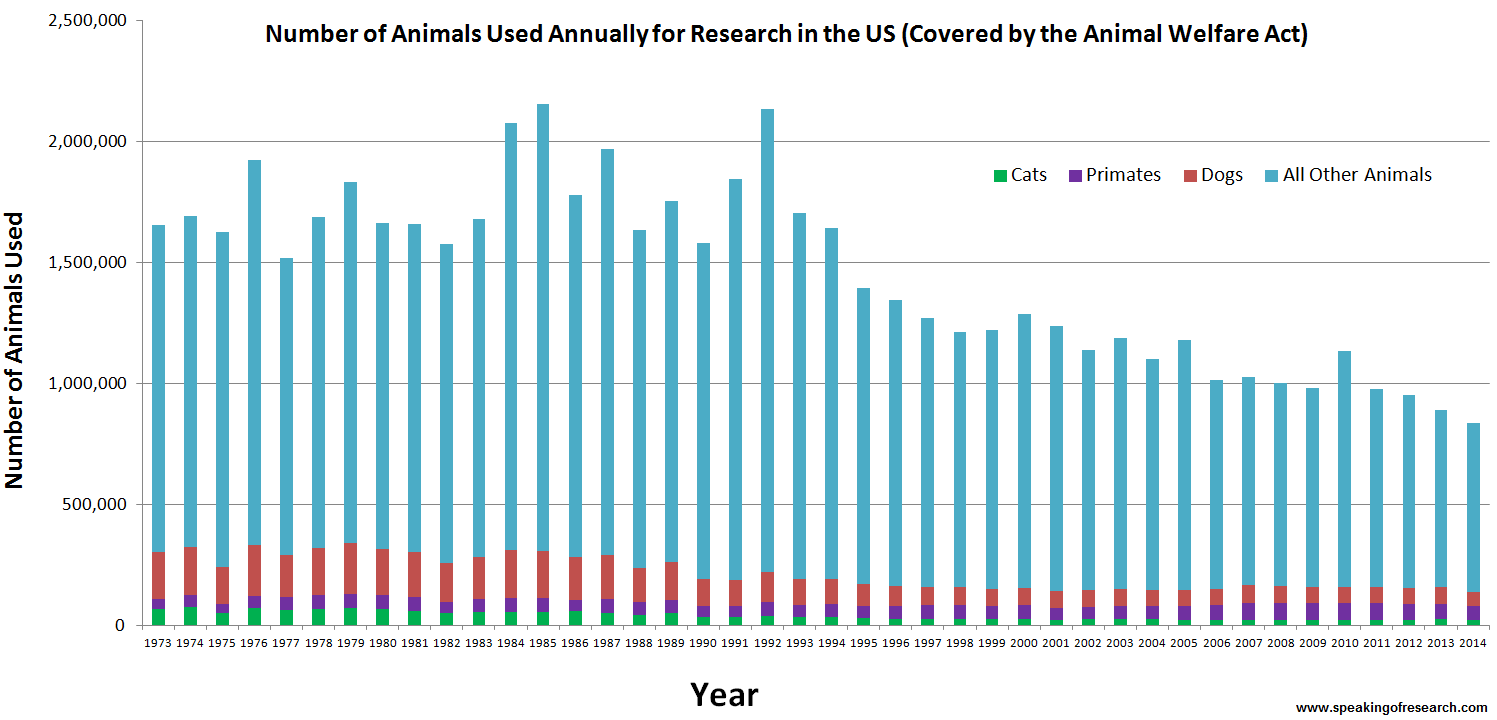
Clearly there has been a downward trend in the number of animals used since the early 1990s with a 61% drop in numbers between 1992 and 2014. It is also likely that, similar to the UK, a move towards using more genetically altered mice and fish has reduced the numbers of other AWA-covered animals used.
Rises and falls in the number of animals used reflects many factors including the level of biomedical activity in a country, trending areas of research, changes to legislations at home and abroad, outsourcing research to and from other countries, and new technologies (which may either replace animal studies or create reasons for new animal experiments).
It is important to note that the number of animals cannot be tallied across years to get an accurate measure of total number of animals. This is because animals in longitudinal studies are counted each year. Thus, if the same 10 animals are in a research facility for 10 years, they would appear in the stats of each year – adding these numbers would incorrectly create the illusion of 100 animals being used.
Speaking of Research welcomes the open publication of these animal research statistics as offering the public a clear idea of what animal research goes on in their country.
