
Allyson J. Bennett & Alanna Brownell
Psychology Department, University of Wisconsin-Madison
Nonhuman animals play an essential role in our understanding of systems that are key to health and disease in humans and other animals. Basic discoveries about physiological, neural, genetic, immunological, and other systems serve as the foundation for advances in medicine, including treatment and prevention. All medical progress, including the development of new drugs and devices, relies on basic scientific knowledge.
Advances that serve public health also depend on studies and pre-clinical testing with animals to help ensure that they are effective and safe before they are widely distributed. Safety and efficacy may not be perfectly guaranteed by animal tests, but in their absence, the probability of human harm is likely to be higher.
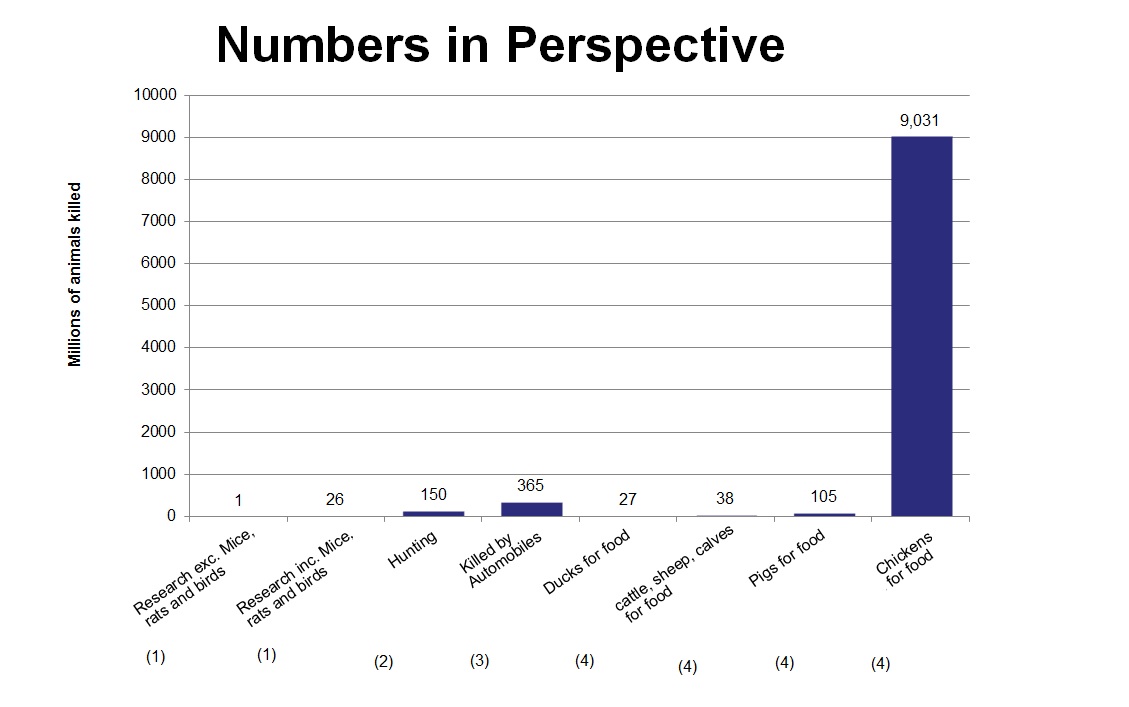
In the US and other countries both basic research and preclinical testing that involves nonhuman animals is subject to oversight and regulation to ensure that humane treatment of animals is balanced with scientific considerations and the potential benefit to humans and other animals. In many countries public interest has resulted in legislative or policy requirements for publicly-available reports on the number of animals in research and testing. In some countries there are corresponding reports on the number of animals used for other purposes. In general, however, countries exclusively report animals used in research and testing. Nonhuman animals used in research and testing are roughly estimated to comprise ~1% of all animals used by humans for a range of purposes that include food, fiber, labor, entertainment, and companionship (see here, here and here for examples of such estimates).
Curiously, animal research and testing are often the only human use of other animals that requires a formal ethical justification by law. It is not uncommon for this justification to fall under different policies and different levels of public transparency (see Bennett & Panicker, 2016 for detail and discussion). Animal research and testing may also be the only category in which there is a formal expectation that the number used should be as small as possible. For example, from US PHS policy: “The animals selected for a procedure should be of an appropriate species and quality and the minimum number required to obtain valid results. Methods such as mathematical models, computer simulation, and in vitro biological systems should be considered.” In some countries, there is also a general assumption that the number of animals in research and testing should decrease over time.
US annual animal number reports
Annual reports of the number of animals used in research are often the subject of media and public attention. Changes in numbers over time are often interpreted and debated in a variety of ways, as was the case in a recent Science Magazine article about the 2017 annual report on nonhuman primates in US research. However, it is not always obvious exactly what the numbers reflect, why they change, and what the reports can—and cannot—explain. Thus, a closer look at how the numbers are reported and why they might vary can be informative for better understanding, serious consideration, and productive dialogue about animal research.
In this article we provide a basic account of how the annual number of animals in research reports are put together, focusing on the US and nonhuman primates. In future posts we may compare the US system to those in other countries that are included in the Speaking of Research statistics page (see here for a complete list).
Basics: Which animals are counted?
In the US, nonhuman primates and other animals living in a wide range of settings fall under federal law via the Animal Welfare Act (AWA; 1966, with subsequent amendments). Mice, rats, and birds that are bred for research do not fall under the AWA but do fall under other federal regulations (see here for detail). Most facilities that house nonhuman primates must obtain a certificate from the United States Department of Agriculture (USDA) and may either be registered for research, or licensed as an exhibitor, dealer, transporter, or breeder. Exhibitors include zoos, but also various entertainment venues. Exhibitors comprise roughly two-thirds of the USDA licensed or registered facilities overall (for additional explanation, detail, and comparison see here and here). Sanctuaries housing nonhuman primates are not required to be registered or licensed by the USDA, although some do acquire exhibitor licenses despite the lack of requirement.
Only research facilities are required to provide an annual report to the USDA to be included in a single publicly-available census document. The report includes the number of AWA-covered animals in each of the four research categories described here by the USDA: “The data in the summary reports represent the number of animals USDA-registered research facilities and Federal research facilities reported as being used or held for research, testing, teaching, experimentation, and/or surgery. The summary reports are based on the Annual Report column designations:
- Column B (animals held by a facility but not used in any research that year)
- Column C (animals used in research; no pain involved; no pain drugs administered)
- Column D (animals used in research; pain involved; pain drugs administered)
- Column E (animals used in research; pain involved; no pain drugs administered)
- Column F (total number of animals used in research; Column C + Column D + Column E)”
The total number of animals used in research (Column F) is the sum of animals reported in Category C-E. Category B is also reported but consists of the number of animals that are not used in research, but are held in the facility (e.g., animals not assigned to research projects). It is common practice to count each animal one time, in the highest category it was assigned during the year (i.e., if the animal were in both a Category C and D research project over the course of a year, it would be counted as a single animal in Category D, but not Category C).
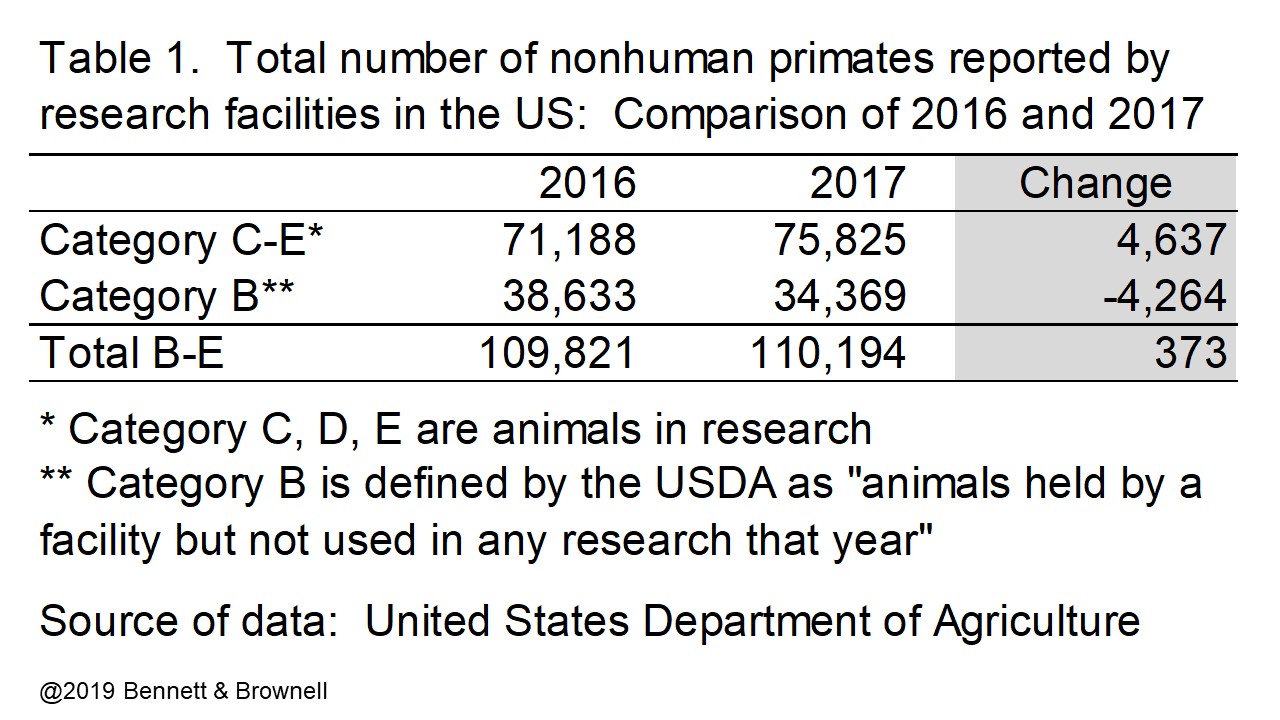
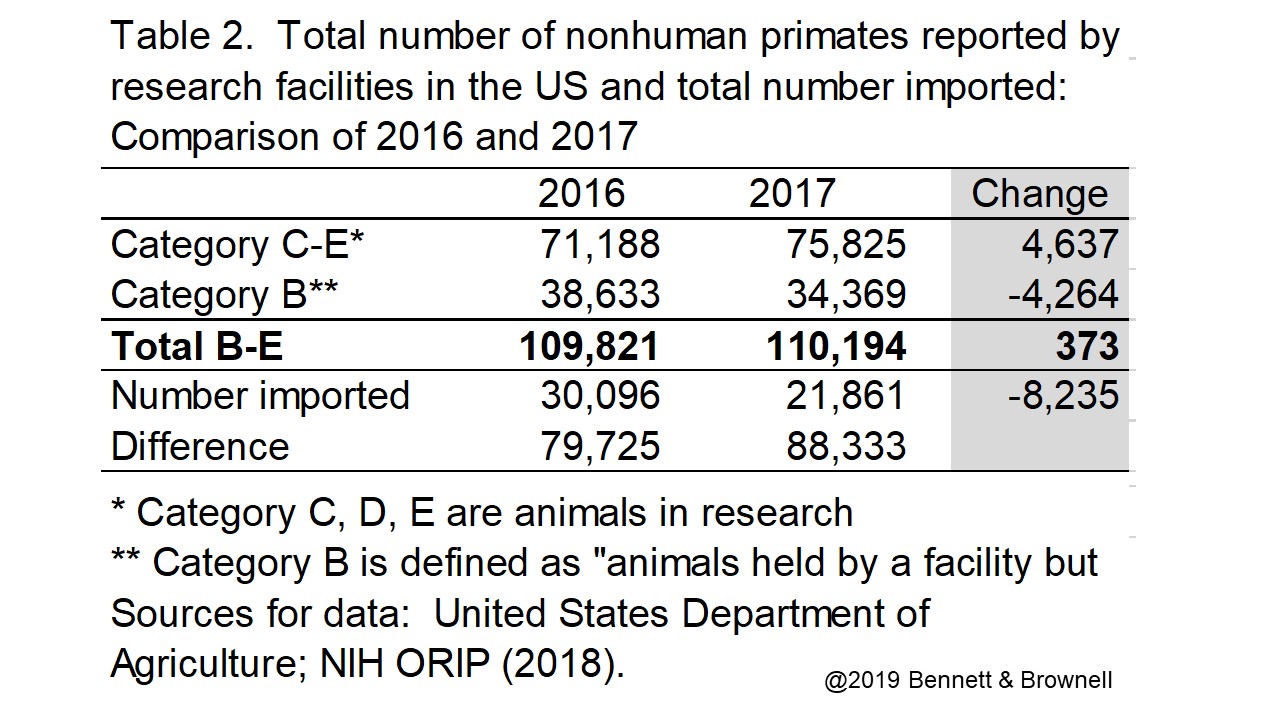
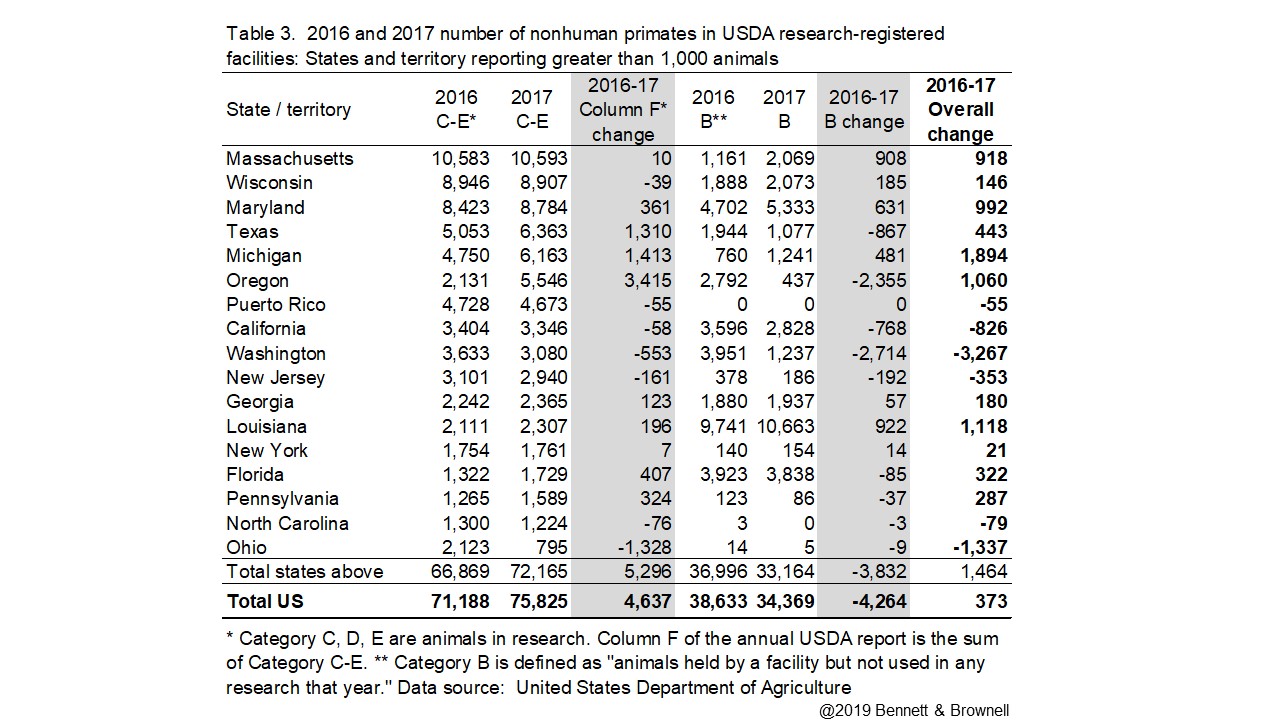
Table 1 shows that the total number of nonhuman primates in research categories in 2016 and 2017 were 71,188 and 75,825, respectively. The total numbers in Category B were 38,633 and 34,369, in 2016 and 2017 respectively. Thus, while there was an increase of 4,637 animals in research categories C-E, there was a drop of 4,264 in animals maintained in research facilities but not used in any research during the year. Considering both Category B and C-E together, there was a total increase of 373 animals from 2016 to 2017. (See here for full USDA reports: annual-report-animal-usage-by-fy2016 and annual-report-animal-usage-by-fy2017).
Can an individual research animal be counted more than once?
The US system does not provide a means for reporting on individual animals over time. The reports are essentially a single year census. In other words, if the same monkey lived in a research facility for 5 years, that monkey would be counted 5 times, once in each of the five annual reports. This situation is likely for many large primate centers, where the same animals are studied over the course of many years and a significant proportion of animals reported each year are the same animals that were reported in the previous years. On the other hand, for some facilities, it could be the case that a proportion of the animals are in terminal studies, or do not remain in the facility, and thus are not counted repeatedly. It is not possible to easily determine whether the number of individual animals within a facility varies over years because the facility could maintain a roughly equal census over time by acquiring new animals from domestic or foreign breeders.
The number of nonhuman primates imported into the US from breeders and facilities in other countries can be found in a 2018 report from the National Institutes of Health Office of Research Infrastructure Programs (pdf here). In 2016, 30,096 nonhuman primates were imported for research, while in 2017 the number was 21,861 (Table 14, p. 29). As a proportion of the total number of nonhuman primates in the annual USDA reports, imported animals appear to account for roughly 20-30% (i.e., 27.4% and 19.8% in 2016 and 2017, respectively). Overall, the annual reports cannot be summed over years to produce a total of unique, or individual, animals.
Where are the animals?
Annual numbers are reported on a state-by-state basis in a single document that can be downloaded from the USDA website (here). States reporting more than 1,000 nonhuman primates in research are shown in Table 3. These states account for over 90% of the 2016 and 2017 totals in Category B and Categories C-E. The table shows increases and decreases from 2016 to 2017. The ten states with facilities reporting the largest number of animals in research were: Massachusetts, Wisconsin, Maryland, Texas, Michigan, Oregon, Puerto Rico, California, Washington, and New Jersey. Of those, half report decreases in the number of animals in research. Research facilities from the other half report increases ranging from 10 to 3,415. Facilities from Texas and Michigan reported increases of 1,310 and 1,413, respectively, while Oregon reported an increase of 3,415. Of note, however, is a decrease of 2,355 animals in Category B for Oregon and a decrease of 867 in Category B for Texas. Thus, it is possible that the increase of animals in research may reflect some individual animals moving between categories (see above).
What accounts for differences between states?
The state data reflect all of the animals reported by the registered research facilities within the state. The annual report for individual facilities is also available at the USDA website. It is worth noting that for companies and facilities with locations in multiple states, the annual report may be submitted from a single location—for instance, the company’s headquarters. Thus, although it is possible (albeit time-consuming) to determine the number and proportion of animals within each state report that are associated with each facility or company, it is not entirely possible to determine the number of animals housed within each state.
Both commercial and publicly-funded research centers house nonhuman primates for research. The USDA does not provide a summary analysis of the number of public versus commercial research facilities. A basic analysis of the states associated with the largest reports of number of nonhuman primates illustrates that the animals contribute to both basic (often federally-funded) research and to research conducted by commercial facilities. For instance, in 2017, the state associated with the largest number of nonhuman primates was Massachusetts. Of those, 87% were reported by the private company Charles River Laboratories. Similarly, in the second highest state, Wisconsin, ~80% nonhuman primates were reported by the private company Covance Laboratories. The University of Wisconsin-Madison, which houses one of the seven National Institutes of Health (NIH) National Primate Research Centers, reported the remaining ~20%.
There are also states in which universities account for most nonhuman primates in research. Louisiana provides an example of this, with Tulane University and the University of Louisiana Lafayette (ULL) accounting for nearly all the nonhuman primates reported to the USDA by registered research facilities in the state. Tulane is home to the Tulane National Primate Research Center, while ULL is home the New Iberia Primate Research Center. In 2017, the two universities accounted for 99.8% of the nonhuman primates in research or maintained for research. Some of the other states that house NPRCs show the same pattern.
Do NIH-funded National Primate Research Centers account for most nonhuman primate research in the US?
A recent report from NIH titled: “Nonhuman Primate Evaluation and Analysis. Part I: Analysis of Future Demand and Supply” (report here) illustrates some of the types of use and distribution of animals across publicly-funded and commercial facilities. The report used 2015 USDA annual reports alongside extensive survey data in order to identify the capacity and anticipated needs for nonhuman primates in research. Research topics, types of studies, and disease areas that rely upon nonhuman primates, focusing primarily on federally-funded NIH research, are included in the report. The data show that the largest planned research use for nonhuman primates is in studies aimed at infectious disease, including HIV/AIDS; systems and behavioral neuroscience; the visual system; reproductive health; and regenerative medicine and transplantation, among many others (see Figure 8, p. 23).
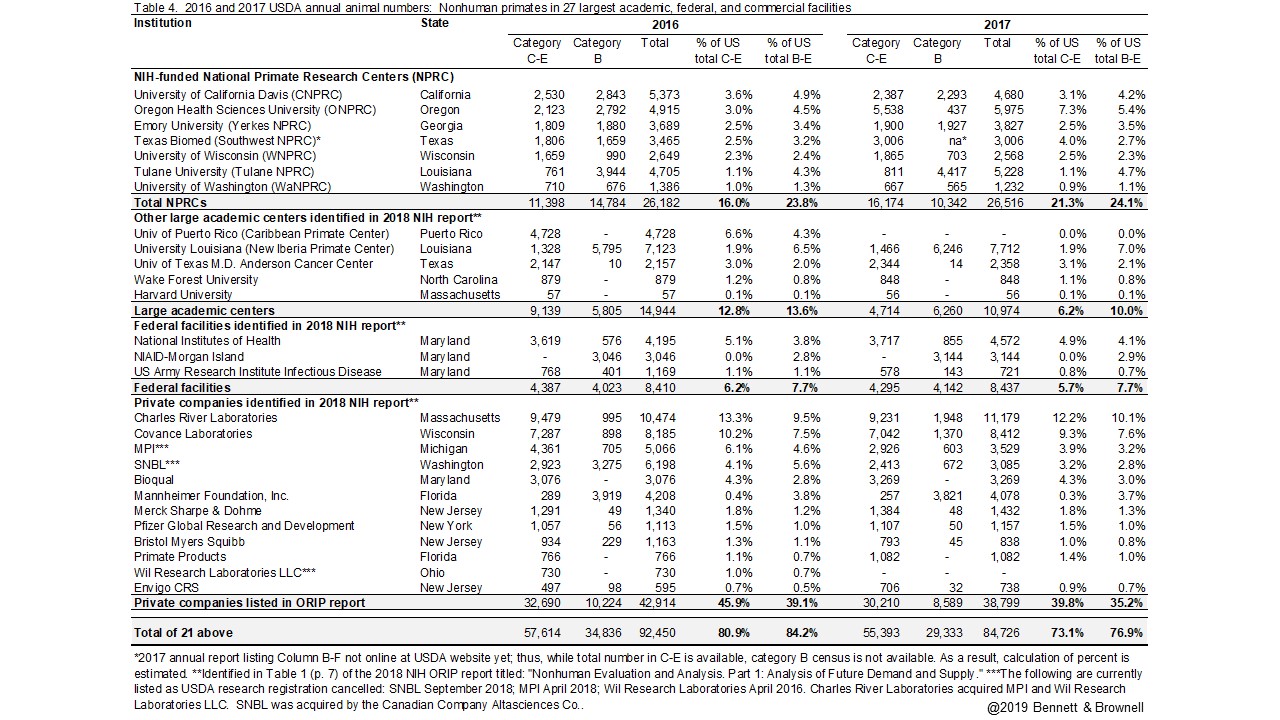
The NIH report used 2015 USDA annual data to identify the 27 largest suppliers of nonhuman primates for research and testing, that “…in aggregate, accounted for 85% of all NHPs housed in the U.S. and 80% of all NHPs used in an active research study” (p. 6). In Table 4 below we used this list to retrieve 2016 and 2017 USDA annual animal numbers reports for each facility. As in 2015, the 27 facilities account for a large proportion of nonhuman primates in research facilities in the US. The analysis also shows that the seven NIH-funded National Primate Research Centers account for roughly one quarter of primates in research facilities in the US, while roughly 35-40% are associated with private companies that include contract research organizations and pharmaceutical companies. Those facilities include companies whose preclinical work is part of the basic research discovery to treatment pipeline that advances new treatments for human and animal health. Overall, the data illustrate why consideration of animal numbers must be broad and inclusive of both public and commercial facilities and of both basic research and animal testing.
Fluctuations over time and across categories
We wrote previously about recent media coverage of changes in US numbers of nonhuman primates in research (see here). In that post, we provide data showing nonhuman primates alongside other AWA-covered species over the entire period for which federal data are available. What isn’t conveyed in the annual numbers reports by the US or any other country is why those numbers change. The factors that influence changes and differences across countries are probably not mysterious. They are likely to be associated with key indicators of the amount, investment, and growth in research. Countries with large biomedical and behavioral research investment likely have larger numbers of animals in research. Countries with rapidly expanding research portfolios are likely to have commensurate increases in animals in research. Similarly, it would not be surprising if changes in biomedical research funding over the period in which animal numbers in the US have been publicly reported—1973-2017—are accompanied by changes in animal numbers. It is also true, however, that one must look to changes in a whole host of factors to understand changes in animal numbers overall and changes within a category. Those factors might include changes in technology, changes in disease, in number of research teams, in where (which countries) research takes place, and any number of other conditions that influence when, where, and how scientists conduct their work.
It is for all these reasons that a simple view of numbers of animals in research does little to serve public interests or public understanding of how science contributes to human and nonhuman animal health. From the perspective of an absolutist—one who believes any use of nonhuman animals by humans is wrong—the only annual animal number report that is acceptable is zero. But for those who recognize that the small fraction of animals used by humans for research and testing has potential benefit to humans and other animals, the question and assessment of use should be more nuanced than “how many?”
References and data resources
Bennett, A.J. & Panicker, S. (2016). Broader impacts: International implications and integrative ethical consideration of policy decisions about US chimpanzee research. Am J Primatology, 78(12), 1282-1303.
Bennett, A.J., & Schoenbeck, E.G. (2018). Where do animals covered by the US Animal Welfare Act live? Analysis of USDA licensed and registered entities. BioRxiv, 379412. https://doi.org/10.1101/37
United States Department of Agriculture. [Internet]. Animal Welfare Act. Available at: https://www.aphis.usda.gov/aphis/ourfocus/animalwelfare/sa_awa/ct_awa_program_information
United States Department of Agriculture. [Internet]. Available at: https://www.aphis.usda.gov/aphis/ourfocus/animalwelfare/SA_Obtain_Research_Facility_Annual_Report
National Institutes of Health, Office of Research Infrastructure and Planning [Internet]. 2018. Nonhuman Primate Evaluation and Analysis. Part I: Analysis of Future Demand and Supply. Available at: https://orip.nih.gov/nonhuman-primate-evaluation-and-analysis-part-1-analysis-future-demand-and-supply
