
The UK Home Office has published the 2015 annual statistics showing the number of animal procedures carried out in Great Britain under the Animals (Scientific Procedures) Act, 1986; this covers all vertebrate species (and Cephalopods). In 2015 there were 4.14 million procedures carried out, up 7.1% from 2014 (3.87 million). However, the Home Office have warned that comparisons with 2014 are likely to be problematic as issues with a new counting procedure (introduced in 2014) are only now being ironed out.
[T]hroughout this release, 2015 data are compared with 2013 data, as neither year of data are subject to the same data quality issues as the 2014 data. However, comparisons between 2015 and 2013 should still be exercised with a degree of caution due to the methodological change in 2014.
When compared to 2013, the number of animal procedures rose 0.5% from 4.12 million procedures.
While we often describe these statistics as being for the UK, they do not include Northern Ireland (who carried out 19,857 procedures in 2014), and so are technically the figures for Great Britain (England, Scotland and Wales).
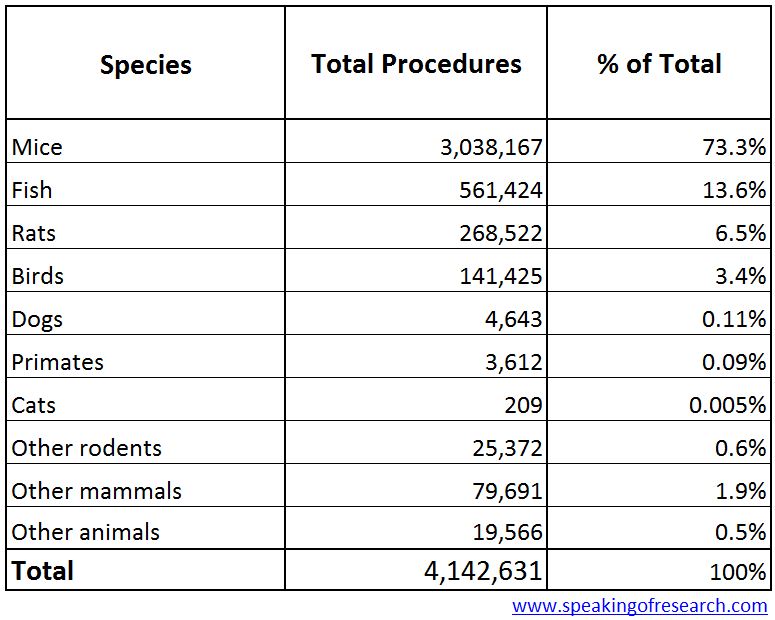
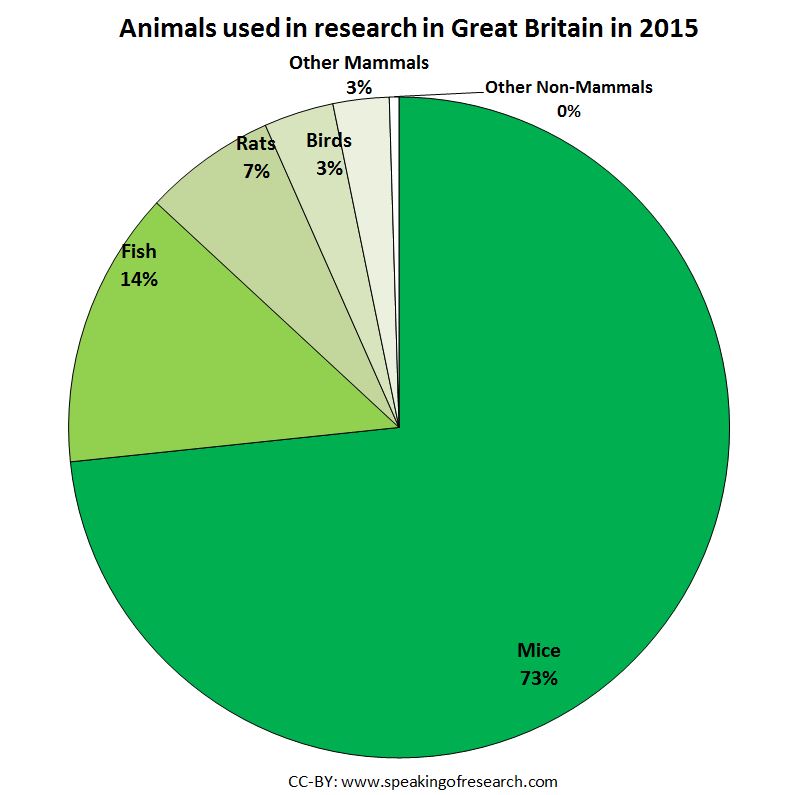
Overall, 96.8% of animals used in scientific studies were mice, rats, fish or birds. Dogs and primates (which are offered special protections under UK law) together accounted for less than 0.2% of the total (similar to in previous years), this becomes 0.21% if cats are included. The statistics also reveal that half of all experiments were the breeding of GM animals which were not used in further experiments – this is almost identical to 2014. Overall, over 67% (two thirds) of all experiments involved genetically modified animals.

Using the trend graph we can see how 2014 data appears to be a blip (as confirmed by the Home Office), with animal experiments remaining relatively constant around 4.1 million. While this is higher than in the 1990s, it remains much lower than the 5.5+ million animals used in the mid 1960s.
Procedures on non-human primates rose slightly from 3,246 procedures in 2014, to 3,612 in 2015. The number of procedures on cats fell by 1 to 209 procedures and on dogs rose to 4,643 (but down slightly from the more accurate 2013 figures).
A ban on cosmetic testing on animals (1998) and of using great apes (gorillas, orang-utans and chimpanzees) in research (1986) meant both had zero procedures in 2015. It should be noted that some research may continue on great apes in zoos, however such research can be observation-based only as “procedures” on great apes are illegal under ASPA.
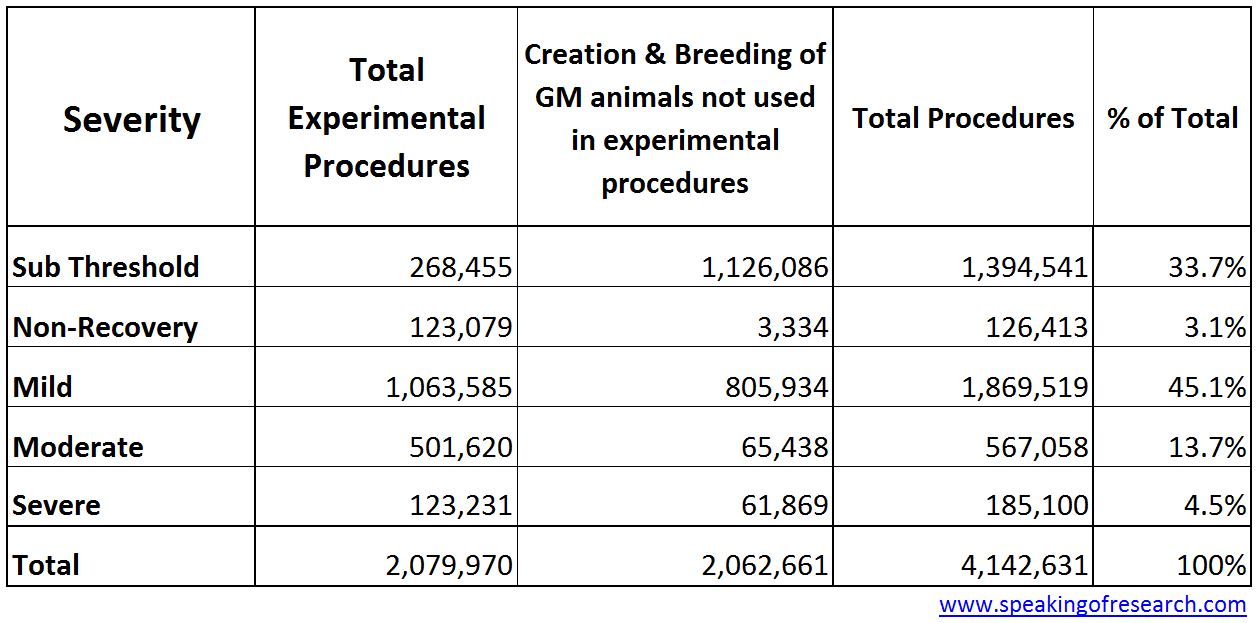
For the second time the UK statistics include retrospective reporting of suffering. Rather than just submitting licence proposals to the Home Office that include estimated levels of suffering, the researchers now have to report on what was actually seen (using a variety of measures). Unfortunately the statistics put these in two separate tables (Table 3 and 8). So we have combined them to get severity for all procedures in 2015. We can see most experiments are sub threshold (34%; less than the introduction of a hypodermic needle) or mild (45%), with remainder as moderate (14%), severe (4.5%) or non-recovery (3%; the animal never awakes from anaesthesia). Overall the proportion of moderate and severe fell from 19.2% in 2014 to 18.2 in 2015.
Other things to note in the UK statistics:
- 49.8% of procedures were for the creation and breeding of genetically altered animals (not used in other experiments), 26.6% were for basic research, 13.4% was for regulatory purposes and 9.7% was translational/applied research [Table 1]
- Over the experimental procedures, two-thirds of the “severe” procedures were regulatory procedures on mice. This is often because death is an endpoint in such procedures [Table 3.1]
- Over 97% of the animals were born in the UK [Table 2.1]
- 47.7% of procedures were conducted in universities and medical schools, 25.1% were in commercial organisations (e.g. pharmaceuticals), 12.4% were done at non-profit making organisations (e.g. medical research charities), and 11.8% were done at other public bodies. [Table 11]
Speaking of Research congratulate the UK government on continuing to produce the most comprehensive statistics on animal experiments worldwide. It is also important to note that these statistics are released as a press conference each year where representatives from the scientific community speak about the importance of animals in research.
Speaking of Research
Find more on the stats here: https://www.gov.uk/government/uploads/system/uploads/attachment_data/file/537708/scientific-procedures-living-animals-2015.pdf
Read last year’s release here: https://speakingofresearch.com/2015/10/22/animal-experiments-in-the-uk-government-releases-2014-statistics/
